Raster Style
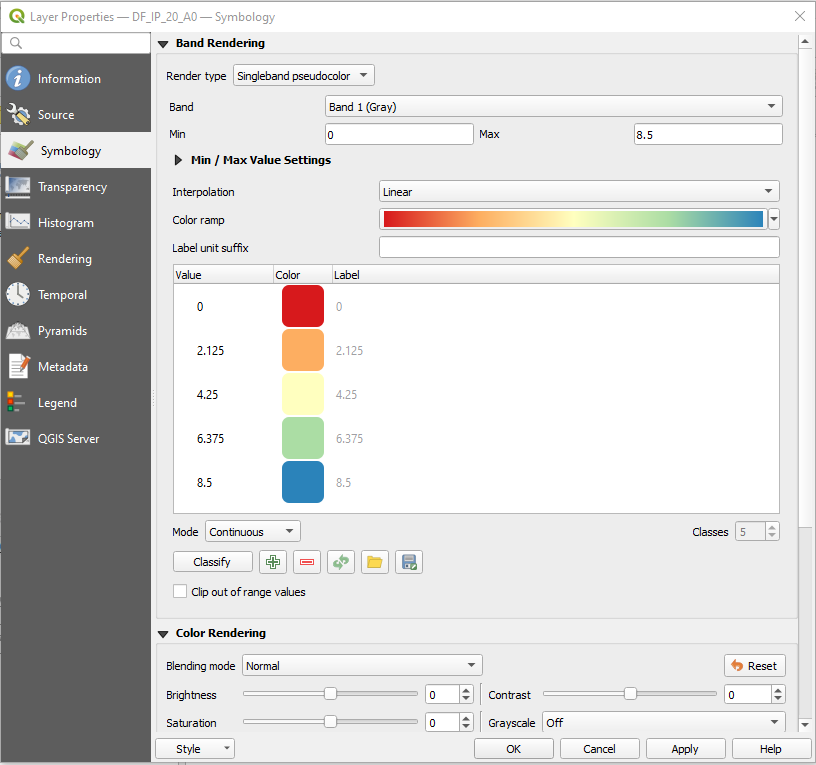
The Raster style is simillar to QGIS singleband pseudocolor.
The below is the example code for raster style
# Import and initialized package
from pysld.style import StyleSld
sld = StyleSld(
            style_name='polygonStyle',
            color_palette='Spectral_r',
            continuous_legend=True,
        )

# Generate the Raster style
style = sld.generate_raster_style(max_value=100, min_value=0)
print(style)
The above code will print the following text,
<StyledLayerDescriptor xmlns="http://www.opengis.net/sld" xmlns:gml="http://www.opengis.net/gml" version="1.0.0" xmlns:ogc="http://www.opengis.net/ogc" xmlns:sld="http://www.opengis.net/sld">
    <UserLayer>
        <sld:LayerFeatureConstraints>
        <sld:FeatureTypeConstraint/>
        </sld:LayerFeatureConstraints>
        <sld:UserStyle>
        <sld:Name>polygonStyle</sld:Name>
        <sld:FeatureTypeStyle>
            <sld:Rule>
            <sld:RasterSymbolizer>
                <Opacity>1</Opacity>
                <sld:ChannelSelection>
                <sld:GrayChannel>
                    <sld:SourceChannelName>1</sld:SourceChannelName>
                </sld:GrayChannel>
                </sld:ChannelSelection>
                <sld:ColorMap type="range">
                    <sld:ColorMapEntry color="#54aead" label=" 0.0" quantity="0.0"/>
                    <sld:ColorMapEntry color="#bfe5a0" label=" 25.0" quantity="25.0"/>
                    <sld:ColorMapEntry color="#fffebe" label=" 50.0" quantity="50.0"/>
                    <sld:ColorMapEntry color="#fdbf6f" label=" 75.0" quantity="75.0"/>
                    <sld:ColorMapEntry color="#e95c47" label=" 100.0" quantity="100.0"/>
                </sld:ColorMap>
            </sld:RasterSymbolizer>
            </sld:Rule>
        </sld:FeatureTypeStyle>
        </sld:UserStyle>
    </UserLayer>
</StyledLayerDescriptor>
Get min_value, max_value of raster
If you like to calculate the min_value and max_value of raster dynamically, you can try following line of code,
from osgeo import gdal

file = r'path/to/tiff/file.tif'
gtif = gdal.Open(file)

srcband = gtif.GetRasterBand(1)
srcband.ComputeStatistics(0)

min_value = srcband.GetMinimum()
max_value = srcband.GetMaximum()